

Typical website conversion rates fall between 1.5% and 5.8% depending on industry and channel, with ecommerce medians closer to 1.7% and cross-channel averages closer to 5%. The right move isn't chasing a single headline number. It's picking the benchmark that matches your own conversion definition (purchase vs. form fill), then tracking your trend against it every month.
TL;DR:
- Ecommerce median conversion rates are roughly 1.74%, with top performers reaching 3% to 4%, making the median the most reliable benchmark for most stores.
- Channel-specific rates vary significantly, with email and paid search averaging 4.9% and 5.4%, respectively, due to pre-qualified traffic and buyer intent.
- Conversion rates are highly dependent on industry, with food and beverage averaging over 6%, while electronics often stay below 2%, reflecting price points and purchase cycles.
- Device differences are critical, as desktops and tablets typically convert higher than mobile, especially during checkout, and mobile abandonment exceeds 70%.
- Seasonal changes and external factors heavily influence monthly benchmarks, so comparisons should always be made within similar timeframes, considering market maturity and audience behavior.
Table of Contents
- What Are the Current Conversion Rate Benchmarks?
- Conversion Rate Benchmarks by Industry: Which Range Applies to You?
- How Do Conversion Rates Differ by Channel and Device?
- Choosing the Right Benchmark: Definitions, Median vs. Mean
- Turning Benchmarks Into Targets, Tests, and Revenue Gains
- What Measurement Mistakes Distort Conversion Rate Comparisons?
- Where the Numbers Come From and Why the Timeframe Matters
- Do Conversion Benchmarks Vary by Region or Market Maturity?
- How Do Customer Demographics and Behavior Change Benchmarks?
- How Much Do Seasonality and External Events Affect Benchmarks?
- Can Conversion Benchmarks Guide Business Forecasting?
- What Are the Limits of Relying on Conversion Rate Benchmarks?
- The Perspective From Digital Marketing All
- Ready to Benchmark and Improve Your Own Conversion Rate?
- Sources
- FAQ
What Are the Current Conversion Rate Benchmarks?
Before you compare your numbers to anyone else's, you need the full spread, not just one average. Different data sources measure different things, which is exactly why the range looks wide.
Ruler Analytics' 2026 study, built on more than 5 million tracked conversions across 13 industries, puts the overall average conversion rate at 5.13%. That figure blends every channel and industry together, so it reads higher than pure ecommerce benchmarks. On the retail side, Shogun's H1 2026 dataset of 745 Shopify stores shows a median of 1.74% and a mean of 2.61%, a gap that matters more than it looks.
Here's the snapshot most marketers actually need:
| Category | Typical range | Notes |
|---|---|---|
| Cross-industry average (all channels) | 3%–4% | Varies by provider and definition |
| Ecommerce (median) | 1.5%–1.8% | Median is the better ecommerce comparator |
| Ecommerce (mean) | 1.6%–1.8% | Skewed upward by top performers |
| B2B / SaaS (lead to opportunity) | 2%–5% | Depends heavily on funnel stage |
| Services (legal, finance) | 2%–8% | High-intent traffic pushes rates up |
| ~4.9% | Warm audience, pre-qualified | |
| Paid search | ~5.4% | Strong buyer intent |
| AI referral | 5.8% | Small volume, high quality |
A few things stand out immediately:
- Ecommerce merchants should benchmark against the 1.74% median, not the 2.61% mean, since a handful of outlier stores pull the average up.
- Top-quartile ecommerce performers typically land in the 3%–4% range, a realistic stretch goal rather than the mean.
- Desktop and tablet traffic still converts higher than mobile in most markets, per Statista's device breakdowns.
- Channel benchmarks (email, paid search) run higher than storefront-wide averages because they carry pre-qualified intent.
Conversion Rate Benchmarks by Industry: Which Range Applies to You?
Vertical matters more than most marketers assume. A furniture store and a snack subscription box are both "ecommerce," but their conversion ceilings live in different universes.
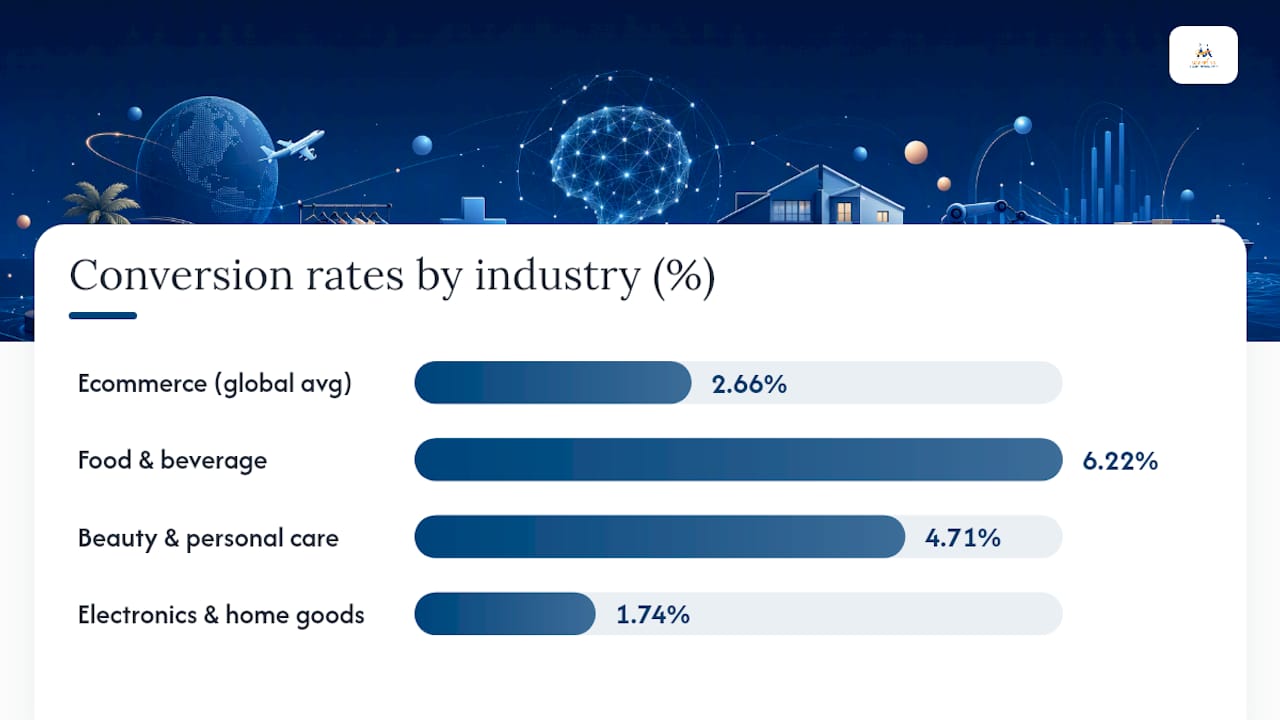
Aggregated 2026 data puts the global ecommerce average at 2.66%, with food and beverage at 6.22% and beauty and personal care at 4.71%, both well above the category norm. Low price points, frequent repurchase, and impulse buying explain the lift. Compare that to consumer electronics, where Polar Analytics reports a conversion rate around 1.74% across a sample of more than 4,000 Shopify brands, a direct reflection of higher average order values and longer research cycles before purchase.
The pattern here is consistent: as ticket price climbs, conversion rate drops, because the decision takes longer and carries more risk for the buyer.
- Food and beverage: 4%–6.2%, driven by low friction and habitual buying.
- Beauty and personal care: 4%–4.7%, helped by subscription models and strong repeat purchase behavior.
- Electronics and home goods: 1.6%–1.8%, suppressed by higher price points and longer comparison shopping.
- Luxury goods: often below 1.5%, since purchase cycles stretch across weeks or months.
B2B and SaaS benchmarks work on an entirely different logic because the "conversion" isn't a purchase. It's a step in a longer funnel. Top-of-funnel form fills might convert visitors at 2%–5%, but the rate that matters more is lead-to-opportunity, which typically runs lower and varies by deal size and sales cycle length. Comparing a SaaS trial signup rate to a lead-to-close rate is comparing two different funnels wearing the same label.
Professional services, legal, and finance sites often report headline rates of 2%–8%, higher than typical ecommerce because their traffic tends to be high-intent search rather than casual browsing. Someone searching for a personal injury lawyer or a tax attorney has already decided they need help. That pre-qualification is why services benchmarks read stronger even though the sales cycle and deal value can be far larger than a retail purchase.
How Do Conversion Rates Differ by Channel and Device?
Channel context changes what "good" means more than almost any other variable. A 5% conversion rate on paid search and a 5% rate on organic social are not equivalent achievements, because the traffic behind each number arrives with wildly different intent.
That AI referral number deserves context: it's a small but fast-growing slice of total traffic, made up largely of people arriving from AI chat tools and assistants after asking a specific question. Those visitors show up pre-qualified in a way that cold organic traffic never does.
AI referral traffic converted at 5.8% in Ruler Analytics' 2026 study, edging out paid search at 5.4% and email at 4.9%, though it still represents a modest share of total sessions compared to established channels.
- Email: Warm, opted-in audience; averages near 4.9%.
- Paid search: High buyer intent, averages near 5.4%.
- Organic search: Wide intent range, from research to ready-to-buy, pulling the average down compared to paid.
- Social: Often the lowest of the major channels, since most visits start as browsing, not buying.
- AI referral: Small volume, high quality, averaging 5.8%.
Device differences add another layer. Statista's data shows desktop and tablet sessions converting higher than mobile across most markets, and cart abandonment rates exceeding 70% in many 2026 datasets, a gap that widens further on mobile checkout flows. If more than a third of your traffic is mobile, and most retail traffic now is, segment your conversion data by device before you draw any conclusions. A site-wide average can mask a mobile checkout problem that's dragging the whole number down.
Choosing the Right Benchmark: Definitions, Median vs. Mean
Picking the wrong comparator is the single most common benchmarking mistake, and it's an easy one to avoid with a short checklist.
- Match the conversion definition. A benchmark built around purchases means nothing next to your form-fill rate. Confirm what the source actually measured before you compare.
- Match the funnel stage. Top-of-funnel signup rates and bottom-of-funnel closed deals are different metrics wearing the same name.
- Match the traffic channel and cohort. A paid search benchmark isn't a fair comparison for organic social traffic, even within the same industry.
- Choose median over mean for ecommerce. Shogun's research notes the median is the better merchant-level comparator, since a handful of exceptional stores pull the mean upward and make typical performance look worse than it is. Treat the 75th percentile as a realistic next milestone rather than the mean as your baseline.
- Adjust for average order value. Higher-ticket items convert at lower rates, so compare within your own price band, not across it.
Two quick scenarios show why this checklist matters. A SaaS company running a free-trial landing page, on the other hand, should be comparing trial signups to other trial signup benchmarks, not to a demo-request rate from a competitor's enterprise sales funnel.
Pro Tip: Pull your own trailing 12-month median before comparing to any external benchmark. Your own trend line, tracked consistently, is more useful than any industry average for deciding whether last month was actually good.
Turning Benchmarks Into Targets, Tests, and Revenue Gains
A benchmark is only useful once it becomes a target you can test against.
- Set a milestone, not a moonshot. If your ecommerce store converts at 1.4% and the vertical median is 1.74%, that gap is your first target. Save the 75th percentile for the second phase.
- Calculate the lift you need. A jump from 1.4% to 1.74% is roughly a 24% relative improvement, which tells you whether a single change will get you there or whether you need several compounding wins.
- Design the test properly. Run an A/B test with a holdout group large enough to detect your minimum detectable effect (MDE). Smaller lifts require larger sample sizes; don't call a test early because the trend looks promising after three days.
- Prioritize by leverage. Page speed, checkout friction, unclear calls to action, and missing social proof tend to produce the fastest measurable gains. Map each benchmark gap to one of these levers before you build anything.
- Track revenue alongside rate. A conversion rate can climb while average order value drops, leaving revenue flat. Focusing on conversions to grow revenue means watching both numbers together, not just the percentage.
- Set a rollout threshold in advance. Decide the statistical confidence level and minimum revenue lift required before you launch a winning variant sitewide, so you're not making that call after seeing an exciting early result.
Most of these experiments live inside broader conversion optimization practices that touch site speed, layout, and checkout flow all at once.
Pro Tip: Test one lever at a time when your traffic volume is limited. Bundling five changes into one test might lift conversions, but you'll have no idea which change actually did the work, and you'll repeat the wrong fix on your next campaign.
What Measurement Mistakes Distort Conversion Rate Comparisons?
Benchmarks fail most often not because the data is wrong, but because the comparison is unfair. A few recurring traps explain most of the confusion marketers run into.
Traffic mix shifts quietly change your baseline. If a seasonal campaign brings in a wave of low-intent browsers, your conversion rate drops even though nothing about your site changed. Attribution model mismatches cause a similar problem: a last-click model and a multi-touch model will report different conversion counts for the exact same sessions, so comparing your last-click rate to an industry average built on multi-touch data is comparing two different measurement systems.
Cart abandonment rates exceeded 70% across many 2026 datasets, according to Statista, a reminder that most published conversion benchmarks already account for significant drop-off between interest and purchase.
- Standardize your conversion definition before pulling any comparison, and write it down.
- Segment benchmark comparisons by traffic source, since organic, paid, and referral behave differently.
- Use a holdout group instead of trusting a raw before/after comparison across a seasonal shift.
- Check that your checkout platform and analytics tool are counting the same event as a "conversion."
CMSWire's analysis of benchmark pitfalls makes a point worth repeating: published benchmarks often track channel health, not revenue outcomes. Pair every external number with your own internal test.
Where the Numbers Come From and Why the Timeframe Matters
Every benchmark in this guide draws from a named, dated source, and that matters because "average conversion rate" changes meaning depending on who measured it and when.
- Ruler Analytics (2026): Cross-industry study of more than 5 million tracked conversions across 13 industries, strong for channel-level detail including the AI referral figure.
- Shogun (H1 2026): 745 Shopify stores, the most useful source for ecommerce median vs. mean comparisons and vertical medians.
- Aggregated industry data (2026): Global ecommerce averages with category breakdowns for food, beverage, and beauty.
- Statista (2026): Device-level and regional conversion data, plus cart abandonment tracking.
Rolling 2026 data reflects current buyer behavior, including the early rise of AI referral traffic, so older benchmarks from 2022 or 2023 will understate what's normal now. Geographic relevance matters too: North American and European ecommerce benchmarks don't always transfer cleanly to emerging markets with different payment and shipping norms. Always match your conversion definition to the source's methodology before you treat a number as your target.
Do Conversion Benchmarks Vary by Region or Market Maturity?
Yes, and the gap is wide enough to distort comparisons if you ignore it. Markets with mature ecommerce infrastructure, established payment systems, fast shipping, and high consumer trust in online buying, tend to post higher and more stable conversion rates than markets where online retail is newer.
In mature markets, consumers have fewer hesitations at checkout. Trusted payment options, transparent return policies, and years of prior online purchases reduce the friction that normally suppresses conversion. Emerging ecommerce markets often show more volatility in conversion data, month to month, because buyer trust is still forming and payment infrastructure (digital wallets, buy-now-pay-later options, cash-on-delivery) varies more widely.
Market maturity also affects channel mix, which indirectly affects conversion benchmarks. A market where social commerce dominates will report different channel-level conversion patterns than one where search and email dominate, even if the underlying products and prices are similar. A benchmark pulled from a well-established Western European or North American dataset may not translate directly to a market where mobile-first shopping and social checkout are the norm.
The practical takeaway: if your business sells across multiple regions, don't apply one blended conversion benchmark to every market. Break your own data out by region first, then compare each region separately to the closest available regional or channel benchmark, rather than holding every market to the same cross-industry average.
How Do Customer Demographics and Behavior Change Benchmarks?
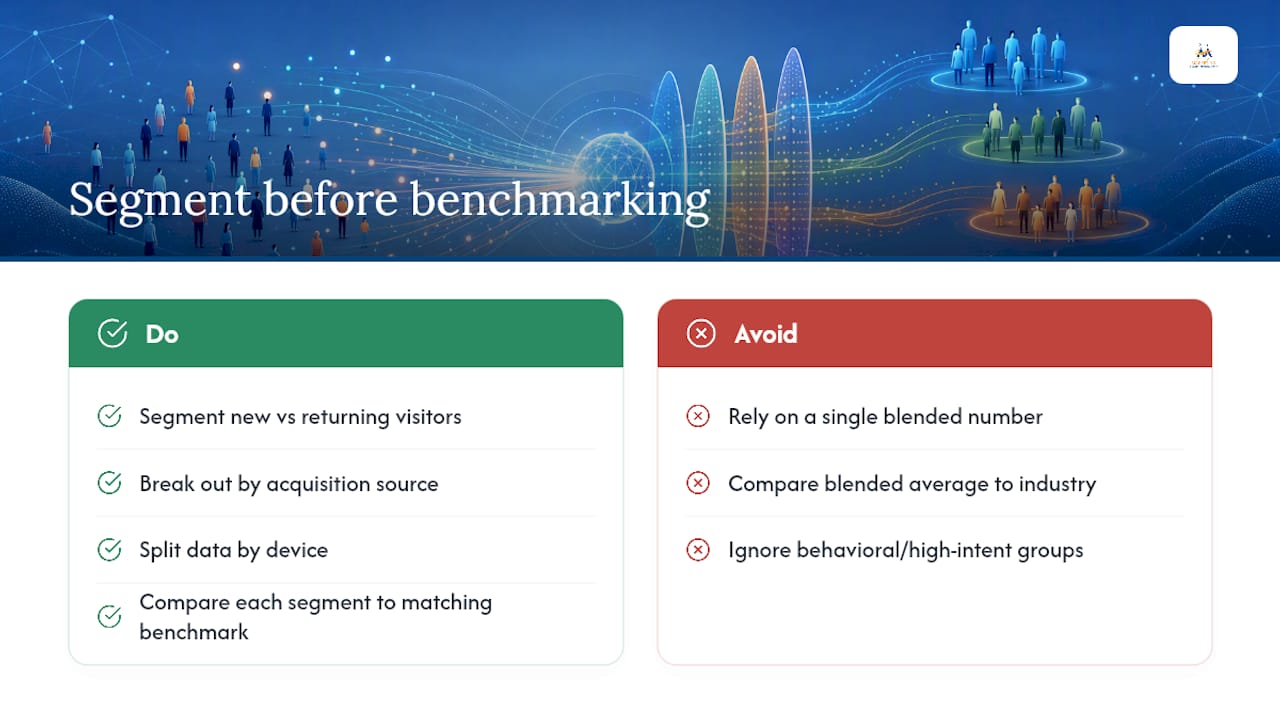
Age, device preference, purchase history, and buying intent all shift what a "normal" conversion rate looks like for a given audience, which is why a single site-wide number can hide more than it reveals.
Returning customers convert at meaningfully higher rates than first-time visitors in nearly every category, because trust and product familiarity remove much of the hesitation new visitors carry. A store with a strong repeat-purchase base will show a healthier blended conversion rate than a comparable store relying mostly on cold traffic, even if their marketing spend and traffic volume look identical on paper.
Behavioral segments matter just as much. Visitors arriving with high purchase intent, someone searching a specific product name versus someone browsing a broad category term, convert at very different rates. Email subscribers and loyalty program members typically convert above the site average because they've already opted into a relationship with the brand. Comparing your blended average to an industry benchmark without separating these groups risks either underselling your performance with high-intent segments or overselling your performance with cold traffic.
Age and generational behavior play a role too, particularly around mobile checkout comfort and payment method preference. Younger shoppers tend to tolerate mobile-first checkout flows better, while older demographics may show stronger conversion on desktop, reinforcing the device-split guidance covered earlier in this guide.
The fix is the same one that applies throughout benchmarking: segment before you compare. Break conversion data out by new versus returning visitors, by acquisition source, and by device, and only then measure each segment against the closest matching benchmark. A single blended number flattens all of this nuance into one misleading figure.
How Much Do Seasonality and External Events Affect Benchmarks?
Seasonality can swing conversion rates by several points in either direction, which means a monthly benchmark comparison without seasonal context is almost meaningless. Holiday shopping periods, back-to-school windows, and major sales events like end-of-year clearance all bring in different visitor mixes than a typical month, and that shift alone changes the conversion rate independent of anything the business did.
During major promotional periods, traffic volume often surges faster than purchase intent does. A flood of deal-seeking, price-comparing visitors can actually lower a site's blended conversion rate even while total revenue climbs, because the incoming audience skews toward browsers rather than committed buyers. Comparing that period's conversion rate to a quiet mid-year month, or to an industry benchmark built from mixed seasonal data, invites the wrong conclusion.
External factors beyond the calendar matter too. Shifts in consumer confidence, changes in shipping costs, or broader economic pressure on discretionary spending all move conversion rates independent of anything happening on the website itself. A benchmark compiled during a period of strong consumer spending won't necessarily hold during a tighter economic stretch, even for an otherwise identical business.
The practical fix is to compare like periods to like periods. Measure this November against last November, not against a random month from earlier in the year, and treat any published annual benchmark as an average across seasonal peaks and valleys rather than a number you should expect every single month. When testing a site change, avoid launching a test that straddles a major seasonal shift, since you won't be able to tell whether the result came from your change or from the calendar.
Can Conversion Benchmarks Guide Business Forecasting?
Benchmarks are useful for more than judging last month's performance. They also help set realistic revenue forecasts, plan budgets, and evaluate whether a new marketing channel is worth expanding, well before any A/B test produces a definitive answer.
When forecasting revenue for a new campaign or channel, a benchmark conversion rate gives you a starting assumption to model against, rather than guessing blind. That's a meaningfully better starting point than assuming your unproven landing page will outperform every published number.
Benchmarks also support budget allocation decisions across channels. Businesses evaluating whether to invest in a new channel, a new market, or a new product line can use category benchmarks to sanity-check whether their internal projections are realistic or overly optimistic.
The strategic use case differs from the testing use case in one key way: forecasting tolerates more uncertainty. You're not trying to prove causation the way an A/B test does. You're trying to set a reasonable expectation for planning purposes, then refining that expectation as real performance data accumulates. Used this way, benchmarks become a planning input alongside historical trend data, not a substitute for it.
What Are the Limits of Relying on Conversion Rate Benchmarks?
Benchmarks are directional, not prescriptive, and treating a published number as a hard target invites bad decisions. CMSWire's analysis makes a point worth repeating here: many published benchmarks track channel health metrics, like open rates or click-throughs, rather than actual revenue outcomes. A channel that looks strong on a benchmark chart isn't automatically the one driving your bottom line.
Sample composition is another blind spot. A benchmark built from 745 Shopify stores, however well-documented, still reflects that specific mix of business sizes, price points, and traffic sources. Your business might sit meaningfully outside that mix, which means the published median is a reference point, not a verdict on your performance.
Benchmarks also can't account for factors unique to your business: brand strength, existing customer loyalty, product differentiation, or a checkout flow with quirks a generic dataset never sees. Two businesses in the same vertical, with the same traffic volume, can post very different conversion rates for reasons no industry benchmark will ever explain.
The safest approach treats benchmarks as one input among several. Combine the published range with your own historical trend, a properly designed A/B test, and a revenue lens that goes beyond the raw percentage. A conversion rate that ties or slightly beats the industry median but drives strong average order value and repeat purchase behavior may be a far healthier business outcome than a rate that beats every benchmark on paper while revenue per visitor lags behind.
The Perspective From Digital Marketing All
Working across client accounts, the pattern is consistent: businesses that treat benchmarks as a starting conversation, not a scoreboard, make better decisions than those chasing an industry average. Some agencies use published ranges to set realistic first milestones for clients, then prioritize experiments around the gap between current performance and the nearest achievable percentile, usually the median first, then the 75th percentile.
The habit worth building is simple: hold the published benchmark next to your own trailing 12-month trend line before setting any target. A benchmark tells you what's typical. Your trend line tells you what's actually changing, and that combination is what turns a static number into a usable target.
— Diane O'Brien
Ready to Benchmark and Improve Your Own Conversion Rate?
Reading benchmarks is one thing. Closing the gap between your current rate and the industry median is another problem entirely, and some agencies specialize in solving this for small and mid-sized businesses. A conversion-focused website design removes the friction that keeps visitors from becoming customers, while Pay Per Result SEO works to bring in the kind of high-intent traffic that converts closer to the top of the ranges covered in this guide. For visitors who leave without converting, Connect Sight works to recapture that lost traffic instead of letting it disappear for good.
If you're not sure where your current rate stands against your industry's benchmark, request a conversion audit and get a clear picture of where the gap is and what's realistic to close first.
Sources
The benchmarks in this guide come from four primary sources, each useful for a different comparison:
- Conversion Rate Benchmarks 2026: Based on 5+ Million Conversions Tracked Across 13 Industries | Ruler Analytics
- Ecommerce conversion rate benchmark | Shogun
- Conversion Rate Benchmarks by Industry: 2026 Data Across All Channels
- Conversion rate of online shoppers worldwide as of 2nd quarter 2022, by region and device — Statista
Reviewing the original datasets directly, rather than a secondhand summary, is worth the extra ten minutes if a specific number will shape your budget or target setting.
FAQ
What Is the Average Ecommerce Conversion Rate?
The median ecommerce conversion rate is 1.74%, with a mean of 2.61% pulled upward by top-performing stores, according to Shogun's 2026 dataset. Median is the more reliable comparator for most merchants.
Why Do AI Referral Visitors Convert at Higher Rates?
AI referral traffic converted at 5.8% in Ruler Analytics' 2026 study, likely because visitors arrive already pre-qualified after asking a specific question through an AI assistant. Volume from this channel remains small compared to established sources like paid search and email.
Should I Use Median or Mean When Benchmarking My Store?
Use median for ecommerce storefront comparisons, since a small number of exceptional stores can pull the mean well above typical performance. Treat the 75th percentile as a realistic stretch goal rather than the average as your baseline.
How Often Should I Compare My Conversion Rate to Industry Benchmarks?
Compare quarterly at minimum, and always segment by channel, device, and season before drawing conclusions. A monthly comparison without seasonal context, especially around holiday periods, tends to produce misleading takeaways.