

What is traffic quality in digital marketing?
Traffic quality measures how relevant, engaged, and likely to convert your website visitors are, rather than how many show up. A site pulling thousands of daily visitors but generating zero leads has a traffic quality problem, not a traffic volume win.
High-quality traffic consists of real human users who arrive with genuine interest, spend meaningful time on your pages, view multiple sections, and take actions that matter to your business. Low-quality traffic includes bots, click farm visits, accidental clicks, and visitors whose intent has nothing to do with your offer.
The core distinction is simple:
- Traffic quantity counts how many sessions your site records.
- Traffic quality asks whether those sessions came from the right people, with the right intent, at the right stage of their decision.
A small, high-intent audience almost always outperforms a large, mismatched one. That gap is where most marketing budgets either grow or quietly drain away.
Key metrics that reveal your traffic quality

Measuring visitor quality means reading a panel of signals together, not chasing a single number. Engagement velocity combines session length, page views, and conversion events to indicate how genuinely interested a visitor is.
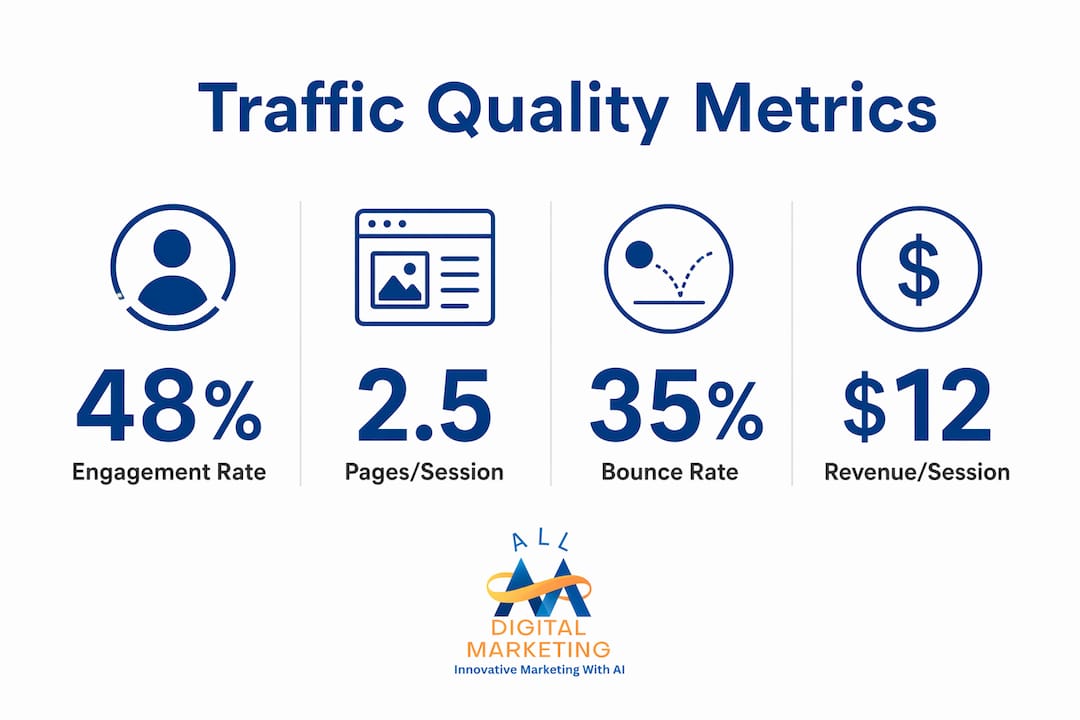
| Metric | What it signals | Quality benchmark |
|---|---|---|
| Bounce rate | Visitor relevance and page match | Context-dependent by page type |
| Pages per session | Depth of interest and site exploration | Higher is generally better |
| Average session duration | Engagement level | Meaningful only alongside other signals |
| Conversion rate by source | Direct link between channel and business outcome | Varies by industry and funnel stage |
| Engagement rate (GA4) | Share of active sessions (conversion, or 2+ pageviews) | Compare against your own page-level median |
Bounce rate is the most misread metric in analytics. A 70% bounce rate on a blog post read end-to-end is perfectly normal. That same rate on a pricing page signals a real problem. Always segment before drawing conclusions.
Signs of low-quality or invalid traffic include:
- Session durations near zero with high bounce rates across the board
- Geographic spikes from regions unrelated to your customer base
- High click or impression counts with flat or declining conversion rates
- Unusual timing patterns, such as traffic surges at odd hours with no behavioral depth
Pro Tip: Pair every acquisition metric with a behavior metric on the same screen. Sessions next to engagement rate. Clicks next to conversion rate. When the two move in opposite directions, you have found a quality problem worth investigating.
Why traffic quality matters more than raw visit counts
Volume without quality creates a specific kind of damage: it inflates your metrics while your revenue stays flat. Invalid traffic inflates clicks, impressions, sessions, and even form submissions, producing misleading reports that push ad platforms to optimize toward the wrong audiences.
The real cost shows up in three ways:
- Wasted budget: Ad spend directed at visitors who never convert is money that cannot be recovered.
- Corrupted attribution: When low-quality sessions flood your data, it becomes harder to identify which channels actually drive results.
- Missed optimization: Campaigns built on inflated engagement signals optimize toward poor-performing traffic sources, compounding the problem over time.
Marketing success depends on identifying traffic sources that generate verifiable downstream business goals, not just total visits. A channel sending fewer visitors but a much higher conversion rate is often the real prize. Prioritizing quality traffic for conversions is where sustainable growth actually begins.
Expert best practices for measuring and improving traffic quality
Experienced marketers move beyond raw visit counts and focus on business outcome metrics. Conversion rate by traffic source is the single most useful metric for linking marketing spend to results, because it reveals which channels deliver visitors who actually do something valuable.
A few practices separate teams that improve traffic quality from those that just monitor it:
- Classify queries by intent before judging a page's performance. Informational, commercial, transactional, and navigational queries each attract different visitors and warrant different success benchmarks.
- Prioritize revenue per session over raw conversion counts. Lower-volume channels can outperform high-volume ones when they deliver higher-value leads.
- Test traffic sources iteratively. Check behavior after each campaign. Keep sources that attract engaged visitors; cut the ones that generate drive-by clicks with no follow-through.
- Align content with visitor intent. A buying-intent query landing on a thin glossary page will bounce regardless of page speed or design.
Many marketers mistake raw visitor counts for success without validating behavior. Shifting focus to conversion-focused measurement changes what you optimize and, ultimately, what you earn.
Common challenges in assessing traffic quality accurately
Traffic quality assessment sounds straightforward until you sit down with real data. Several pitfalls trip up even experienced analysts.
Misreading bounce rate in isolation is the most common error. Context, page type, and traffic source all determine whether a bounce rate warrants action. A single blended site-wide figure hides everything that matters.
Confusing accidental clicks with fraud leads to wrong responses. Not all low-quality traffic is fraudulent. Many visits result from accidental clicks or irrelevant targeting rather than malicious bots. Distinguishing between the two requires analyzing geographic patterns, session timing, and behavioral depth together, not just flagging high bounce rates.
Relying on site-wide averages masks the real story. A blended engagement rate of 55% is meaningless if your highest-intent pages sit at 80% and a bloated tag archive drags the mean down. Quality lives at the page and query level.
Ignoring assisted conversions causes teams to undervalue channels that warm up prospects before a final conversion elsewhere. Last-click attribution erases organic and social contributions that genuinely moved the sale forward.
Skipping CRM integration leaves a gap between what GA4 reports and what actually closed as revenue. Matching GA4 engagement data against CRM outcomes reveals which traffic segments convert into paying customers, not just leads.
Key Takeaways
Traffic quality measures visitor relevance, engagement, and conversion likelihood, and it consistently outranks raw visit volume as a predictor of real marketing ROI.
| Point | Details |
|---|---|
| Quality over quantity | High-intent, smaller audiences regularly outperform large, mismatched visitor pools. |
| Read metrics in context | Bounce rate and session duration only mean something when segmented by page type and traffic source. |
| Conversion rate by source | This metric directly links marketing spend to business outcomes and reveals your best channels. |
| Revenue per session | Prioritize value per visit over conversion counts to find your highest-performing traffic sources. |
| Iterative testing wins | Regularly review source behavior, keep what converts, and cut what only looks busy. |
Why traffic quality is the metric that actually changes outcomes
Most marketers I work with already know traffic volume is a vanity metric. The harder shift is building a reporting culture where quality signals, not session counts, drive decisions. That shift changes everything downstream.
When you stop celebrating traffic spikes and start asking which sources produced engaged visitors who converted, your budget allocation gets sharper. Campaigns that looked successful because they drove clicks get cut. Channels that looked modest but delivered qualified visitors get more investment. The data stops being a report and starts being a decision tool.
The teams that get this right do one thing consistently: they benchmark against their own page-level medians, not industry averages. They know what a good engagement rate looks like for their pricing page specifically, not for "B2B SaaS" in general. That specificity is what separates useful measurement from dashboard theater.
If you want to put this into practice, Digitalmarketingall helps businesses build traffic strategies grounded in real engagement and conversion data. Start with a reputation and visibility audit to understand where your current traffic stands before scaling anything.
FAQ
What is traffic quality in simple terms?
Traffic quality measures whether your website visitors are relevant, engaged, and likely to convert, rather than simply counting how many people arrived.
Which metrics best indicate high-quality web traffic?
Conversion rate by traffic source, engagement rate, pages per session, and revenue per session are the strongest indicators, because they connect visitor behavior directly to business outcomes.
How do you spot low-quality or invalid traffic?
Look for near-zero session durations, geographic spikes from irrelevant regions, and high click volumes paired with flat conversion rates. These patterns often signal bot activity or severe audience mismatch.
Is a high bounce rate always a sign of poor traffic quality?
No. A 70% bounce rate is normal for informational blog posts but problematic on a pricing or conversion page. Always interpret bounce rate in the context of page type and traffic source.
How often should you review traffic quality metrics?
Weekly reviews keep your data accurate and allow timely adjustments. Regular monitoring helps you catch quality drops before they compound into wasted budget or corrupted campaign data.