

TL;DR:
- Customer journey mapping visually captures every step, emotion, and touchpoint a customer encounters with your brand. It helps teams identify friction, prioritize improvements, and break departmental silos for better customer experience. The most effective maps are evidence-based, continuously updated, and accompanied by clear action plans and ownership.
Customer journey mapping is a visual, research-backed blueprint of every step a customer takes with your organization, from the first moment they hear about you to the point where they recommend you to others. It documents touchpoints, emotions, and channels to expose friction that blocks conversions and erodes retention. Marketing, product, and support teams all use these maps to move from internal assumptions to customer-centered evidence, then prioritize the fixes that matter most.
A complete journey map delivers five core outputs:
- Persona: A specific customer type with defined goals, behaviors, and pain points
- Stages: The sequential phases of the customer's experience (Awareness through Advocacy)
- Touchpoints: Every interaction between the customer and your brand across channels
- Emotions: The customer's feelings and confidence level at each stage
- Prioritized actions: A ranked list of improvements tied to real friction data
Table of Contents
- What is customer journey mapping and why does it matter for CX?
- Core components every journey map should include
- What types of journey maps should you use?
- A practical stage framework with touchpoints and metrics
- How to create a customer journey map step by step
- Common mistakes teams make and how to fix them
- Which tools and templates help you build a journey map?
- How to measure the impact of your journey map
- Short examples and a starter map template
- Key Takeaways
- The gap between a beautiful map and a useful one
- How Digital Marketing All supports your journey mapping goals
- Useful sources
- FAQ
What is customer journey mapping and why does it matter for CX?
Most organizations make decisions based on what they think customers experience. Journey mapping replaces that assumption with evidence. According to Harvard Business School, the method creates a visual representation of the entire customer experience, documenting touchpoints, thoughts, and emotions to identify friction that prevents conversions and retention.
The business payoff is concrete. When teams map touchpoints and analyze interactions at scale, they can optimize channel targeting, personalize messaging, and shorten sales cycles. That means fewer lost leads at the consideration stage, faster onboarding, and higher retention rates after purchase.
Journey maps also break down departmental silos. Marketing sees what happens after the click. Support understands what the sales team promised. Product learns where users drop off before they ever contact support. That shared view, as Nielsen Norman Group notes, surfaces gaps that single-department KPIs routinely miss.
Three use cases where maps create immediate impact:
Onboarding flow. A SaaS company maps the first 14 days after signup and discovers that a significant share of users never complete profile setup because the prompt appears on day one, before users understand the product's value. Moving the prompt to day three, after a key activation event, reduces early churn.
Checkout funnel. An e-commerce brand maps the path from cart to confirmation and finds that shipping cost disclosure at the final step causes the highest abandonment rate. Surfacing costs earlier in the flow recovers a measurable share of those lost orders.
Support escalation. A service business maps the path from a customer's first complaint to resolution and finds three unnecessary handoffs between departments. Eliminating two of them cuts average resolution time and lifts post-interaction satisfaction scores.
Stat to know: SAS research confirms that accurate touchpoint tracking enables organizations to build richer customer profiles, improve targeting across channels, and increase ROI through better messaging and faster sales cycles.
Core components every journey map should include
Journey maps combine storytelling and visualization to build a shared organizational view of the customer experience. Getting that right means including the right building blocks from the start.
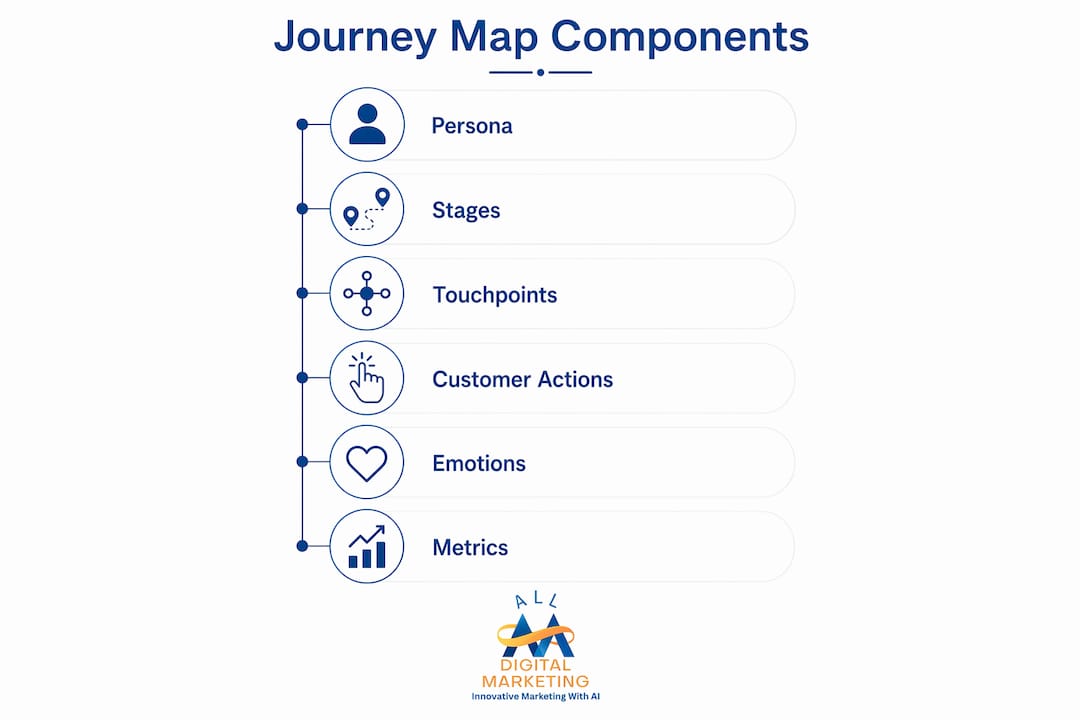
Persona and scenario. A persona is a research-based profile of one specific customer type: their goals, frustrations, and typical behaviors. The scenario is the specific situation you are mapping, such as "a first-time buyer completing a purchase on mobile." You always map one persona in one scenario. Trying to map all customers at once produces a map that describes no one accurately.

Stages. These are the sequential phases the customer moves through, typically Awareness, Consideration, Conversion, Post-Purchase, and Retention. Each stage has a distinct customer goal and a distinct set of brand interactions.
Touchpoints and channels. A touchpoint is any moment of contact between the customer and your brand: a Google search result, a product page, a confirmation email, a support chat. The channel is where that contact happens: organic search, email, phone, in-app. Mapping both lets you see where channel gaps create friction.
Customer actions. What does the customer actually do at each touchpoint? Click an ad, read a review, call support, abandon a cart? Documenting actions reveals behavioral patterns that surveys alone never capture.
Emotions and state data. Rate the customer's emotional state at each stage, from frustrated to confident. This is where the map becomes a diagnostic tool. A sharp drop in emotional state at a specific touchpoint tells you exactly where to focus.
Metrics and ownership. Each insight or friction point needs a measurable indicator (conversion rate, abandonment rate, CSAT score) and a named owner responsible for acting on it. Without ownership, maps become decorative.
Pro Tip: Add a "moments of truth" row to your map. These are the two or three touchpoints where the customer makes a trust decision. Prioritize those above everything else.
What types of journey maps should you use?
Not every mapping goal calls for the same format. Choosing the right type saves time and produces more useful output.
Current-state map. Documents the experience as it exists today, including friction, gaps, and emotional lows. Use this when you need to diagnose a problem or build a shared baseline before making changes. Most teams start here.
Future-state (to-be) map. Describes the ideal experience you want to design. Use this after a current-state map has identified the biggest gaps. It becomes the brief for product, design, and marketing teams.
Service blueprint. Extends the customer-facing map to include backstage processes, systems, and staff actions that support each touchpoint. Use this when the root cause of customer friction is an internal process failure, not a front-end design issue.
Day-in-the-life map. Zooms out beyond your brand to show the customer's full daily context, including competing priorities and other brands they interact with. Useful for understanding why customers disengage even when your product works well.
Channel-specific map. Focuses on one channel, such as email or mobile app, to optimize a specific interaction path. Use this when you already know which channel is underperforming and need granular detail.
For a first map, keep the scope tight: one persona, one scenario, one map type. Government Communications Service guidance recommends mapping to identify "moments of truth" and compare current versus desired customer responses, which is exactly what a current-state map does well.
A practical stage framework with touchpoints and metrics
Most B2B and small-business frameworks use five core stages. The table below shows each stage, representative touchpoints, and the metrics that tell you how well that stage is performing.
| Stage | Customer Goal | Sample Touchpoints | Key Metrics |
|---|---|---|---|
| Awareness | Recognize a problem and find options | Google search, social ad, blog post, word of mouth | Organic impressions, ad reach, branded search volume |
| Consideration | Evaluate solutions and compare options | Website landing page, review sites, demo request, email nurture | Time on page, email open rate, demo conversion rate |
| Conversion | Complete a purchase or sign-up | Checkout flow, pricing page, sales call, contract signing | Conversion rate, cart abandonment rate, cost per acquisition |
| Post-Purchase | Get value from the product quickly | Onboarding email, welcome call, in-app tutorial, support chat | Onboarding completion rate, time-to-first-value, support ticket volume |
| Retention/Advocacy | Continue using the product and recommend it | Loyalty program, review request, referral program, renewal email | NPS, churn rate, referral rate, repeat purchase rate |

Mapping emotions alongside these metrics is where the framework earns its value. A customer in the Consideration stage who feels confused by your pricing page will not convert, even if your product is the best option. Capturing that emotional signal points directly to the fix.
For customer journey SEO, aligning your content strategy to these stages means the right message reaches the right person at the right moment, which shortens the path to conversion.
How to create a customer journey map step by step
This workflow produces a usable first map. Follow the steps in order.
Step 1: Define your objective and scope. Decide what problem you are solving. "Reduce checkout abandonment" is a good objective. "Improve the customer experience" is too broad. Output: a one-sentence objective and a chosen persona + scenario.
Step 2: Build your persona. Use real data, not guesses. Pull from CRM records, support tickets, and customer interviews. A minimum viable persona includes: name/label, primary goal, top frustration, preferred channels, and a one-sentence behavioral description.
Step 3: Gather data from multiple sources. Combine qualitative and quantitative inputs. Effective mapping requires both customer interviews and digital analytics for a balanced, testable map. Sources to pull from:
- Customer interviews (5–8 is enough for a first map)
- Support tickets and call recordings
- Website analytics and session recordings
- NPS and CSAT survey responses
- Social media comments and reviews
Step 4: List every touchpoint for your chosen scenario. Walk through the scenario from the customer's perspective and list every moment of contact. Do not filter yet. Get everything on the board.
Step 5: Map emotions and pain points. For each touchpoint, rate the customer's emotional state (frustrated, neutral, confident) and note any friction or unmet expectation. This is the diagnostic layer of the map.
Step 6: Validate with real customers and analytics. Show your draft map to three to five customers and ask them to correct it. Then cross-reference emotional lows with analytics data: high exit rates, long support queues, low completion rates. Where both signals align, you have a confirmed friction point.
Step 7: Prioritize and assign ownership. Rank friction points by impact and effort. Pick the top three to address in the next 30 days. Assign a named owner to each. Most teams fail to operationalize maps because they treat them as static documents. A 30-day action plan with clear ownership changes that.
Step 8: Schedule a review cycle. Set a calendar reminder to revisit the map every 30–60 days. Customer behavior changes. Your map should too.
Pro Tip: You do not need a perfect map to get started. Many teams produce a useful first map in roughly 90 minutes when they limit scope to one persona and one scenario. Run a 90-minute workshop with three to five stakeholders, a whiteboard, and sticky notes. That minimum viable map is enough to surface your top friction point and assign an owner.
Common mistakes teams make and how to fix them
Mapping assumptions instead of evidence. The most damaging mistake is building a map from what your team thinks customers experience. Every touchpoint and emotion on the map should trace back to a real data source: an interview, a support log, an analytics report.
Over-scoping the first map. Trying to map every persona across every channel produces a map that is too complex to act on. Start with one persona, one scenario, and one map type. Expand after you have completed one full cycle of map, validate, act, and measure.
Leaving the map static. A map that lives in a slide deck and never gets updated is a waste of effort. Convert every map session into a 30-day action plan with named owners and scheduled check-ins.
Siloing the mapping process. If only the marketing team builds the map, it will reflect marketing's blind spots. Include someone from sales, support, and product in every mapping session. The NN/g research is clear: departmental siloing is the most common barrier to realizing map impact.
Relying only on survey data. Customers do not always report their real frustrations in surveys. They do reveal them in support calls, chat logs, and social comments.
Pro Tip: Pull your last 20 support tickets or call recordings before your next mapping session. Unsolicited customer data reveals friction that surveys miss entirely. You will find friction points your team never knew existed.
Which tools and templates help you build a journey map?
You do not need expensive software to build a useful first map. The right tool depends on your team's size, technical comfort, and research needs.
-
Miro: A visual collaboration platform well-suited for real-time workshop-style mapping with distributed teams. Miro offers pre-built journey map templates, sticky note boards, and integrations with tools like Slack, Jira, and Google Drive. Its free tier supports unlimited boards for small teams, making it a strong starting point for most organizations. Best for: visual collaboration and cross-functional workshops.
-
Qualtrics: An enterprise CX research platform that goes beyond visualization. Qualtrics collects survey data, NPS scores, and behavioral signals, then surfaces them in journey-level dashboards. Best for: organizations that need to ground their maps in large-scale quantitative research or run ongoing CX measurement programs. Pricing is not publicly listed.
-
Google Slides or FigJam: Free options that work well for small teams building their first map. Less structured than Miro, but zero cost and no learning curve.
-
Spreadsheet-based maps: A simple Google Sheet with columns for Stage, Touchpoint, Channel, Customer Action, Emotion, and Owner is often enough for a first map. It is easy to share, update, and convert into a 30-day action plan.
When to upgrade tools: Start with a free tool. Move to a platform like Miro when your team needs real-time collaboration across locations. Add a research platform like Qualtrics when you need to validate maps with statistically meaningful customer data rather than small-sample interviews.
For teams using AI-powered marketing funnels, integrating journey map data with your analytics stack gives you a feedback loop that keeps the map current without manual updates.
How to measure the impact of your journey map
A map without measurement is a hypothesis. These KPIs tell you whether your fixes are working.
| KPI | How to Measure | What Improvement Looks Like |
|---|---|---|
| Stage conversion rate | Analytics: sessions → next-stage completions | Increase of 5% after touchpoint fix |
| Touchpoint abandonment rate | Exit rate or drop-off in funnel analytics | Reduction after friction is removed |
| Onboarding completion rate | Product analytics: % completing setup steps | Higher completion after sequence reorder |
| CSAT after key interaction | Post-interaction survey (1–5 scale) | Score increase of 0.3 points |
| NPS | Periodic survey: likelihood to recommend | Upward trend over 60–90 day cycles |
| Support ticket volume | Helpdesk data by touchpoint or issue type | Decrease after self-service improvement |
Simple experiment ideas to test map hypotheses:
Run an A/B test on the touchpoint with the highest abandonment rate. Change one variable: the copy, the timing, the channel, or the offer. Measure conversion rate before and after. For onboarding, try a targeted email sequence that triggers based on user behavior rather than a fixed schedule. For support escalation, test a faster first-response time and measure its effect on CSAT.
Timeline expectations: A minimum viable map takes one to two weeks to build and validate. Your first experiment should run within 30–60 days of completing the map. Expect early programs to surface two to three high-impact fixes per quarter. Mature programs, where maps are updated continuously and tied to product roadmaps, produce compounding improvements over six to twelve months.
Short examples and a starter map template
Example 1: E-commerce checkout journey. Persona: a returning customer buying on mobile. Key touchpoints: product page, cart, shipping cost reveal, payment screen, confirmation email. Emotional low: the shipping cost reveal at checkout. Prioritized action: surface shipping costs on the product page. Result: measurable reduction in cart abandonment at the payment step.
Example 2: SaaS onboarding flow. Persona: a small business owner in their first week after signup. Key touchpoints: welcome email, in-app setup wizard, first feature use, day-7 check-in email. Emotional low: the setup wizard, which requires integrating a third-party tool before showing any value. Prioritized action: reorder the wizard to show a quick win before the integration step. Result: higher completion rates and improved user retention shortly after signup.
Example 3: Support escalation. Persona: a customer with a billing dispute. Key touchpoints: help center search, chatbot, phone queue, agent handoff, resolution email. Emotional low: the handoff between chatbot and phone agent, where context is lost and the customer must repeat their issue. Prioritized action: pass chatbot conversation history to the phone agent automatically. Result: shorter call times and higher post-interaction CSAT.
How to use the starter template:
- Copy the stage table from the Stages section above into a Google Sheet or Miro board.
- Add rows for: Customer Action, Emotional State (1–5), Pain Point, and Owner.
- Fill in one column (one stage) at a time using your data sources.
- Validate each column with at least one real customer before moving to the next.
- After completing all stages, highlight the three cells with the lowest emotional state scores. Those are your first three priorities.
For social media touchpoints, add a row for unsolicited social mentions at each stage. Comments and reviews often surface friction that never appears in formal feedback channels.
Key Takeaways
Customer journey mapping works because it replaces internal assumptions with customer evidence, turning friction points into prioritized, owned actions that improve conversion and retention.
| Point | Details |
|---|---|
| Start narrow | Map one persona in one scenario first; expand scope only after completing a full act-measure cycle. |
| Validate before acting | Cross-reference emotional lows on the map with analytics data to confirm real friction before committing resources. |
| Assign ownership | Every friction point needs a named owner and a 30-day deadline, or the map stays decorative. |
| Measure with specific KPIs | Track stage conversion rate, abandonment rate, onboarding completion, and NPS to quantify map impact. |
| Digital Marketing All | Digital Marketing All applies journey mapping insights to build conversion-focused websites and AI-powered visibility strategies for small and mid-sized businesses. |
The gap between a beautiful map and a useful one
Most teams spend too much time on the visual and not enough on the validation. A polished map built from internal assumptions is less useful than a rough sketch grounded in ten real customer conversations. The map is not the deliverable. The prioritized action plan is.
There is also a tendency to treat journey mapping as a one-time project. Teams run a workshop, produce a map, present it to leadership, and file it away. Six months later, customer behavior has shifted, a new competitor has entered the market, and the map reflects a reality that no longer exists. The teams that get real value from mapping treat it as an ongoing practice, not a project. They update the map when NPS drops, when a new product launches, or when support ticket volume spikes in a specific stage.
One more thing worth saying directly: the emotional layer is where most maps fall short. Teams are comfortable documenting touchpoints and channels because those are observable. Emotions feel subjective, so they get approximated or skipped. But the emotional state column is often the most diagnostic part of the entire map. A customer who feels confused at the consideration stage will not convert, regardless of how good your product is. A customer who feels ignored after purchase will not renew. Capturing those signals, even imperfectly, points you toward the fixes that move the metrics.
How Digital Marketing All supports your journey mapping goals
If you have the map but need help executing on what it reveals, Digital Marketing All works with small and mid-sized businesses to turn journey insights into measurable results. The agency's approach covers the full implementation path: from conversion-focused website design that addresses friction at key touchpoints, to reputation and review management that strengthens the advocacy stage.
Service scope includes:
- Research and mapping workshops to build your first validated map quickly
- Touchpoint optimization across web, search, and local channels using AI-powered visibility tools
- Prioritized action plans tied to your specific KPIs and business goals
- Implementation support for conversion improvements, content alignment, and post-purchase retention
Ready to act on what your map reveals? Contact Digital Marketing All to get a clear next step for your highest-priority friction point.
Useful sources
These are the primary references used to build this guide. Each one is worth bookmarking for deeper study.
- Harvard Business School Online: Solid theoretical grounding on what journey maps are and how they expose friction. Best for understanding the methodology's purpose.
- Nielsen Norman Group: The most rigorous practitioner guidance available on when and how to create maps, including scenario selection and narrative structure.
- Contentsquare: Practical focus on the business benefits of mapping, with emphasis on analytics integration and ROI.
- SAS: Strong on the data and targeting side of journey mapping, particularly for organizations with existing analytics infrastructure.
- Government Communications Service (GCS): Useful for service-design oriented maps and the "moments of truth" framework, applicable beyond public sector.
- U.S. Chamber of Commerce: Practical tips for small businesses, including the value of unsolicited customer data.
For implementation help, visit Digital Marketing All.
FAQ
What are the five main points of a customer journey?
The five core stages are Awareness, Consideration, Conversion, Post-Purchase, and Retention/Advocacy. Each stage represents a distinct customer goal and a corresponding set of brand touchpoints and metrics.
What are the four stages of customer journey mapping?
Some frameworks compress the journey into four stages: Awareness, Evaluation, Purchase, and Loyalty. The five-stage model is more common in B2B and small-business contexts because it separates onboarding (Post-Purchase) from long-term retention, which are distinct problems requiring different fixes.
What are the seven steps to create a customer journey map?
The core steps are: (1) define your objective and scope, (2) build a research-based persona, (3) gather qualitative and quantitative data, (4) list every touchpoint for your chosen scenario, (5) map emotions and pain points at each touchpoint, (6) validate the map with real customers and analytics, and (7) prioritize the top friction points, assign owners, and build a 30-day action plan.
How long does it take to build a first journey map?
A minimum viable map can be completed in roughly 90 minutes when scope is limited to one persona and one scenario. A fully validated map with customer interviews and analytics cross-referencing typically takes one to two weeks for a small team.
What is the biggest mistake teams make with journey maps?
Treating the map as a static document is the most common failure. Maps that are not tied to a 30-day action plan with named owners rarely produce change. The second most common mistake is building the map from internal assumptions rather than real customer data.